
Install the TCG app
how_to_install_app_on_ios
follow_along_with_video_below_to_see_how_to_install_our_site_as_web_app

Note: this_feature_currently_requires_accessing_site_using_safari
You are using an out of date browser. It may not display this or other websites correctly.
You should upgrade or use an alternative browser.
You should upgrade or use an alternative browser.
💬 OT So its raining right now.....
- Thread starter Chef Ramsay
- Start date
More options
Who Replied?

https://earthobservatory.nasa.gov/images/145101/record-setting-precipitation-leaves-us-soils-soggy
.The continental United States recently finished its soggiest 12 months in 124 years of modern recordkeeping. The results are visible in satellite measurements of fresh water.
From May 1, 2018, to April 30, 2019, the lower 48 states collectively averaged 36.20 inches (919.48 millimeters) of precipitation, a full 6.25 inches (158.75 mm) above the mean. The previous record (April 2015 to March 2016) was 35.95 inches. According to the National Centers for Environmental Information, ten U.S. states had their wettest 12 months, and three others were in the top three. Many of them were clustered in the Mid-Atlantic and Midwest regions.
According to the May 21 report from the U.S. Drought Monitor, just 2.72 percent of the contiguous U.S. was in drought, among the lowest levels in two decades of records. California is completely out of drought for the first time since 2011. As recently as February 2018, one-third of the United States was in drought.
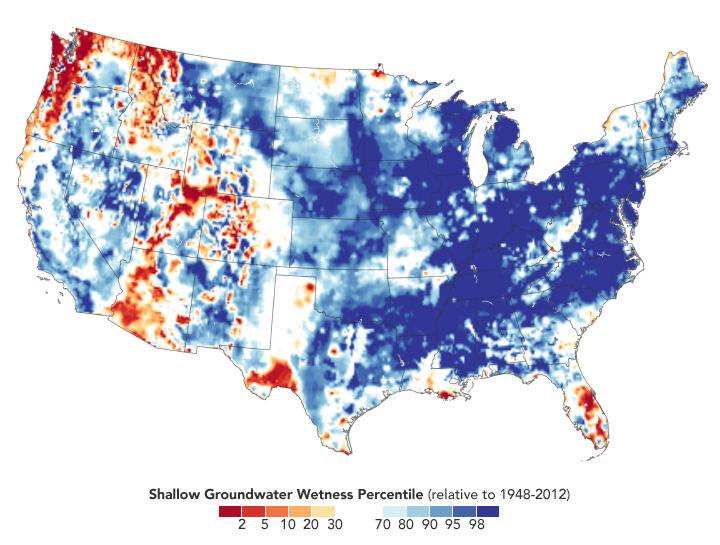
The map above shows how groundwater has responded to the unusually wet year. The colors depict the wetness percentile; that is, how the amount of groundwater on May 13, 2019, compares to all Mays from 1948 to 2012. Blue areas have more abundant groundwater than usual for the time of year, and orange and red areas have less. The map is based on multiple types of meteorological data (precipitation, temperature, etc.) integrated within an advanced computer model developed by scientists at NASA’s Goddard Space Flight Center.

Yup, we were doing garage beer for one.pop up shower in elgin yesterday evening, soI'm not surprised.
Looks like this system is a bit more North than what the news reported yesterday.
save the beer !
Now, in the bar


The funny thing was, delivery 'Za's over in Geneva/St. Charles all night, only like 5 miles west of West Chicago, where it dumped, it was dry as dry could be. IT was quite the site going up/down either Kirk Rd. or Kautz Rd. because it was dark blue immediately to the east. But sunny and bright where we were. Good thing I got the grass done over at the WeGo house before I went in.


Thread Info
-
 Created
 -
8KReplies
-
190KViews
-
Participants list