
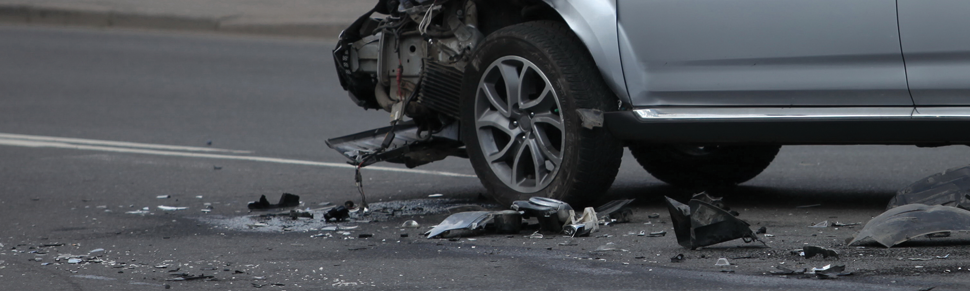
…. And back to drunk drivers and this vehicle crash
Install the TCG app
how_to_install_app_on_ios
follow_along_with_video_below_to_see_how_to_install_our_site_as_web_app

Note: this_feature_currently_requires_accessing_site_using_safari
You are using an out of date browser. It may not display this or other websites correctly.
You should upgrade or use an alternative browser.
You should upgrade or use an alternative browser.
More options
Who Replied?
If the focus is also age, then statistics say to hone in on younger drivers (teens) through mid-30 yrs as the focus group for fatality related accidents.
If you drive in Chicagoland roadways, keep an eye on 30s - 50s age group for aggressive driving / road rage.
If you drive in Chicagoland roadways, keep an eye on 30s - 50s age group for aggressive driving / road rage.

This is only partially true, you're probably thinking of the total number of fatal crashes in those age groups which is not useful because you need to account for the number of drivers in the group and how many miles they drive on average. Not surprisingly, 80+ has the highest fatality rateIf the focus is also age, then statistics say to hone in on younger drivers (teens) through mid-30 yrs as the focus group for fatality related accidents.
If you drive in Chicagoland roadways, keep an eye on 30s - 50s age group for aggressive driving / road rage.
Rates of Motor Vehicle Crashes, Injuries and Deaths in Relation to Driver Age, United States, 2014-2015 - AAA Foundation for Traffic Safety
This Research Brief presents updated data on crash risk using data on crashes from the US DOT in conjunction with data on driving mileage from the AAA Foundation's American Driving Survey.
aaafoundation.org
This is only partially true, you're probably thinking of the total number of fatal crashes in those age groups which is not useful because you need to account for the number of drivers in the group and how many miles they drive on average. Not surprisingly, 80+ has the highest fatality rate
Rates of Motor Vehicle Crashes, Injuries and Deaths in Relation to Driver Age, United States, 2014-2015 - AAA Foundation for Traffic Safety
This Research Brief presents updated data on crash risk using data on crashes from the US DOT in conjunction with data on driving mileage from the AAA Foundation's American Driving Survey.aaafoundation.org
View attachment 152174
Here is the rest of your data chart, which is from 2014-2015. Youngest to middle 30s.
Highest % is youth through 34 yrs of age
This is only partially true, you're probably thinking of the total number of fatal crashes in those age groups which is not useful because you need to account for the number of drivers in the group and how many miles they drive on average. Not surprisingly, 80+ has the highest fatality rate
Rates of Motor Vehicle Crashes, Injuries and Deaths in Relation to Driver Age, United States, 2014-2015 - AAA Foundation for Traffic Safety
This Research Brief presents updated data on crash risk using data on crashes from the US DOT in conjunction with data on driving mileage from the AAA Foundation's American Driving Survey.aaafoundation.org
View attachment 152174
im glad you found this data because i was going to.

The data is very telling. You shouldn't be able to drive until you're 18 and you shouldn't be able to drive if you're 80+. Period.
If the focus is also age, then statistics say to hone in on younger drivers (teens) through mid-30 yrs as the focus group for fatality related accidents.
If you drive in Chicagoland roadways, keep an eye on 30s - 50s age group for aggressive driving / road rage.
You specifically referenced fatality related accidents, then ignore that in the data because it disagrees with your claim?Here is the rest of your data chart, which is from 2014-2015. Youngest to middle 30s.
View attachment 152182
Highest % is youth through 34 yrs of age
View attachment 152181
Simply pointed out you posted partial data and within my follow up, if you scroll a little further down, is more current than you red chart.You specifically referenced fatality related accidents, then ignore that in the data because it disagrees with your claim?
I posted the data that was directly relevant to your claim. The rest was not relevant since you referenced fatal accidents.Simply pointed out you posted partial data and within my follow up, if you scroll a little further down, is more current than you red chart.
Now you can argue that the cause for increased fatal accident rates in the 80+ age group is because old people die easier, not because of the severity of the accidents they cause, which may have merit.
Freedom be scary yo.I don't like the idea that it's "Your GoD GIvEn rIgHt" to have a firearm.
That shit should be earned.
Alot of people are not capable of being a responsible owner.
The UK is that way.
I posted the data that was directly relevant to your claim. The rest was not relevant since you referenced fatal accidents.
Now you can argue that the cause for increased fatal accident rates in the 80+ age group is because old people die easier, not because of the severity of the accidents they cause, which may have merit.
The second chart I posted was from 2020, while your data was 2014/2015.

And that 2020 chart doesn't show the rate of fatal accidents by category (and I don't feel like calculating it for each one), and doesn't account for average miles driven by category which is a big factorThe second chart I posted was from 2020, while your data was 2014/2015.
Is there some reason to believe that 80+ year olds somehow became significantly better drivers between 2015 and 2020? If anything I like my data more because it's a full two year sample size, and if you read the methodology, whoever did that study was very thorough
And that 2020 chart doesn't show the rate of fatal accidents by category (and I don't feel like calculating it for each one), and doesn't account for average miles driven by category which is a big factor
Is there some reason to believe that 80+ year olds somehow became significantly better drivers between 2015 and 2020? If anything I like my data more because it's a full two year sample size, and if you read the methodology, whoever did that study was very thorough
The whole chart below, which following the data the 16 - 34 drivers have the higher fatality rates. Source is also in the images.
Does grandma / grandpa kill people on the roadways? Yes, but let’s not underestimate the main population of drivers who need more attention on the roadways.
If anything, we need more frequent education and testing for all ages, especially younger adults.
And again, drunk driving played the key role in the 2014 accident in Oak Lawn.
Let’s be honest, both age groups suck at driving…for different reasons obviously…
Young people due to phones/showing off/lack of experience
Old people because their skills are leaving them
Young people due to phones/showing off/lack of experience
Old people because their skills are leaving them
Thread Info
-
 Created
 -
39Replies
-
739Views
-
Participants list