
Re-entered $LEDS on a small sell and got filled at $9.88. Sold a couple pieces in the $10's, got stuck in a halt (downward), and sold my remainder of shares at $11.09 (I figured this would hit around $12's but I needed to get out as my family needs me). I was in this trade, and doubled down when I was alerted to a price target of $12, and then possibly $16, but I'm happy with my profits for today.
Install the TCG app
how_to_install_app_on_ios
follow_along_with_video_below_to_see_how_to_install_our_site_as_web_app

Note: this_feature_currently_requires_accessing_site_using_safari
You are using an out of date browser. It may not display this or other websites correctly.
You should upgrade or use an alternative browser.
You should upgrade or use an alternative browser.
More options
Who Replied?$BGFV up 12% today. Yesterday they announced a special dividend payout of $1 per share plus increased their normal quarterly dividend to $.18 per share.

would be nice if cciv would pick up once again, just need Lucid motors to get moving.
One last funny one that we can all relate to :

It's trading within a channel of roughly mid $13s and as high as roughly $15ish. According to a reputable person he believes we can see good movement this week based off the short interest and return dates that have to be covered. So we shall see. He gave a rough pt of $21. He does believe we should see good upward movement by the 14th.what happened to MVIS
What I do know is that we are still in consolidation and MVIS is heavily manipulated. I do believe we should see at least another spike before the May shareholders call (and I'm betting a couple options on it, but they're my lotto plays). One thing I noticed was that when we were green today and the SPY dumped, mvis went back to red but as soon as he hit certain points, we bounced right back to other areas. MVIS has strong support in this general area and somewhat of a resistance in the $14s. Any PR and we will probably spike up pretty good.
It's going to be a volatile week. With the oil pipeline shutdown that happened over the weekend, the market is probably going to have some buying opportunities this week.
Lol. Not yet, but a micro-breakout. It's been relatively trading within a channel for a while with higher lows. So we're still on an uptrend overall. You can look at it on the weekly chart with the daily candles.MVIS to the moon? lol
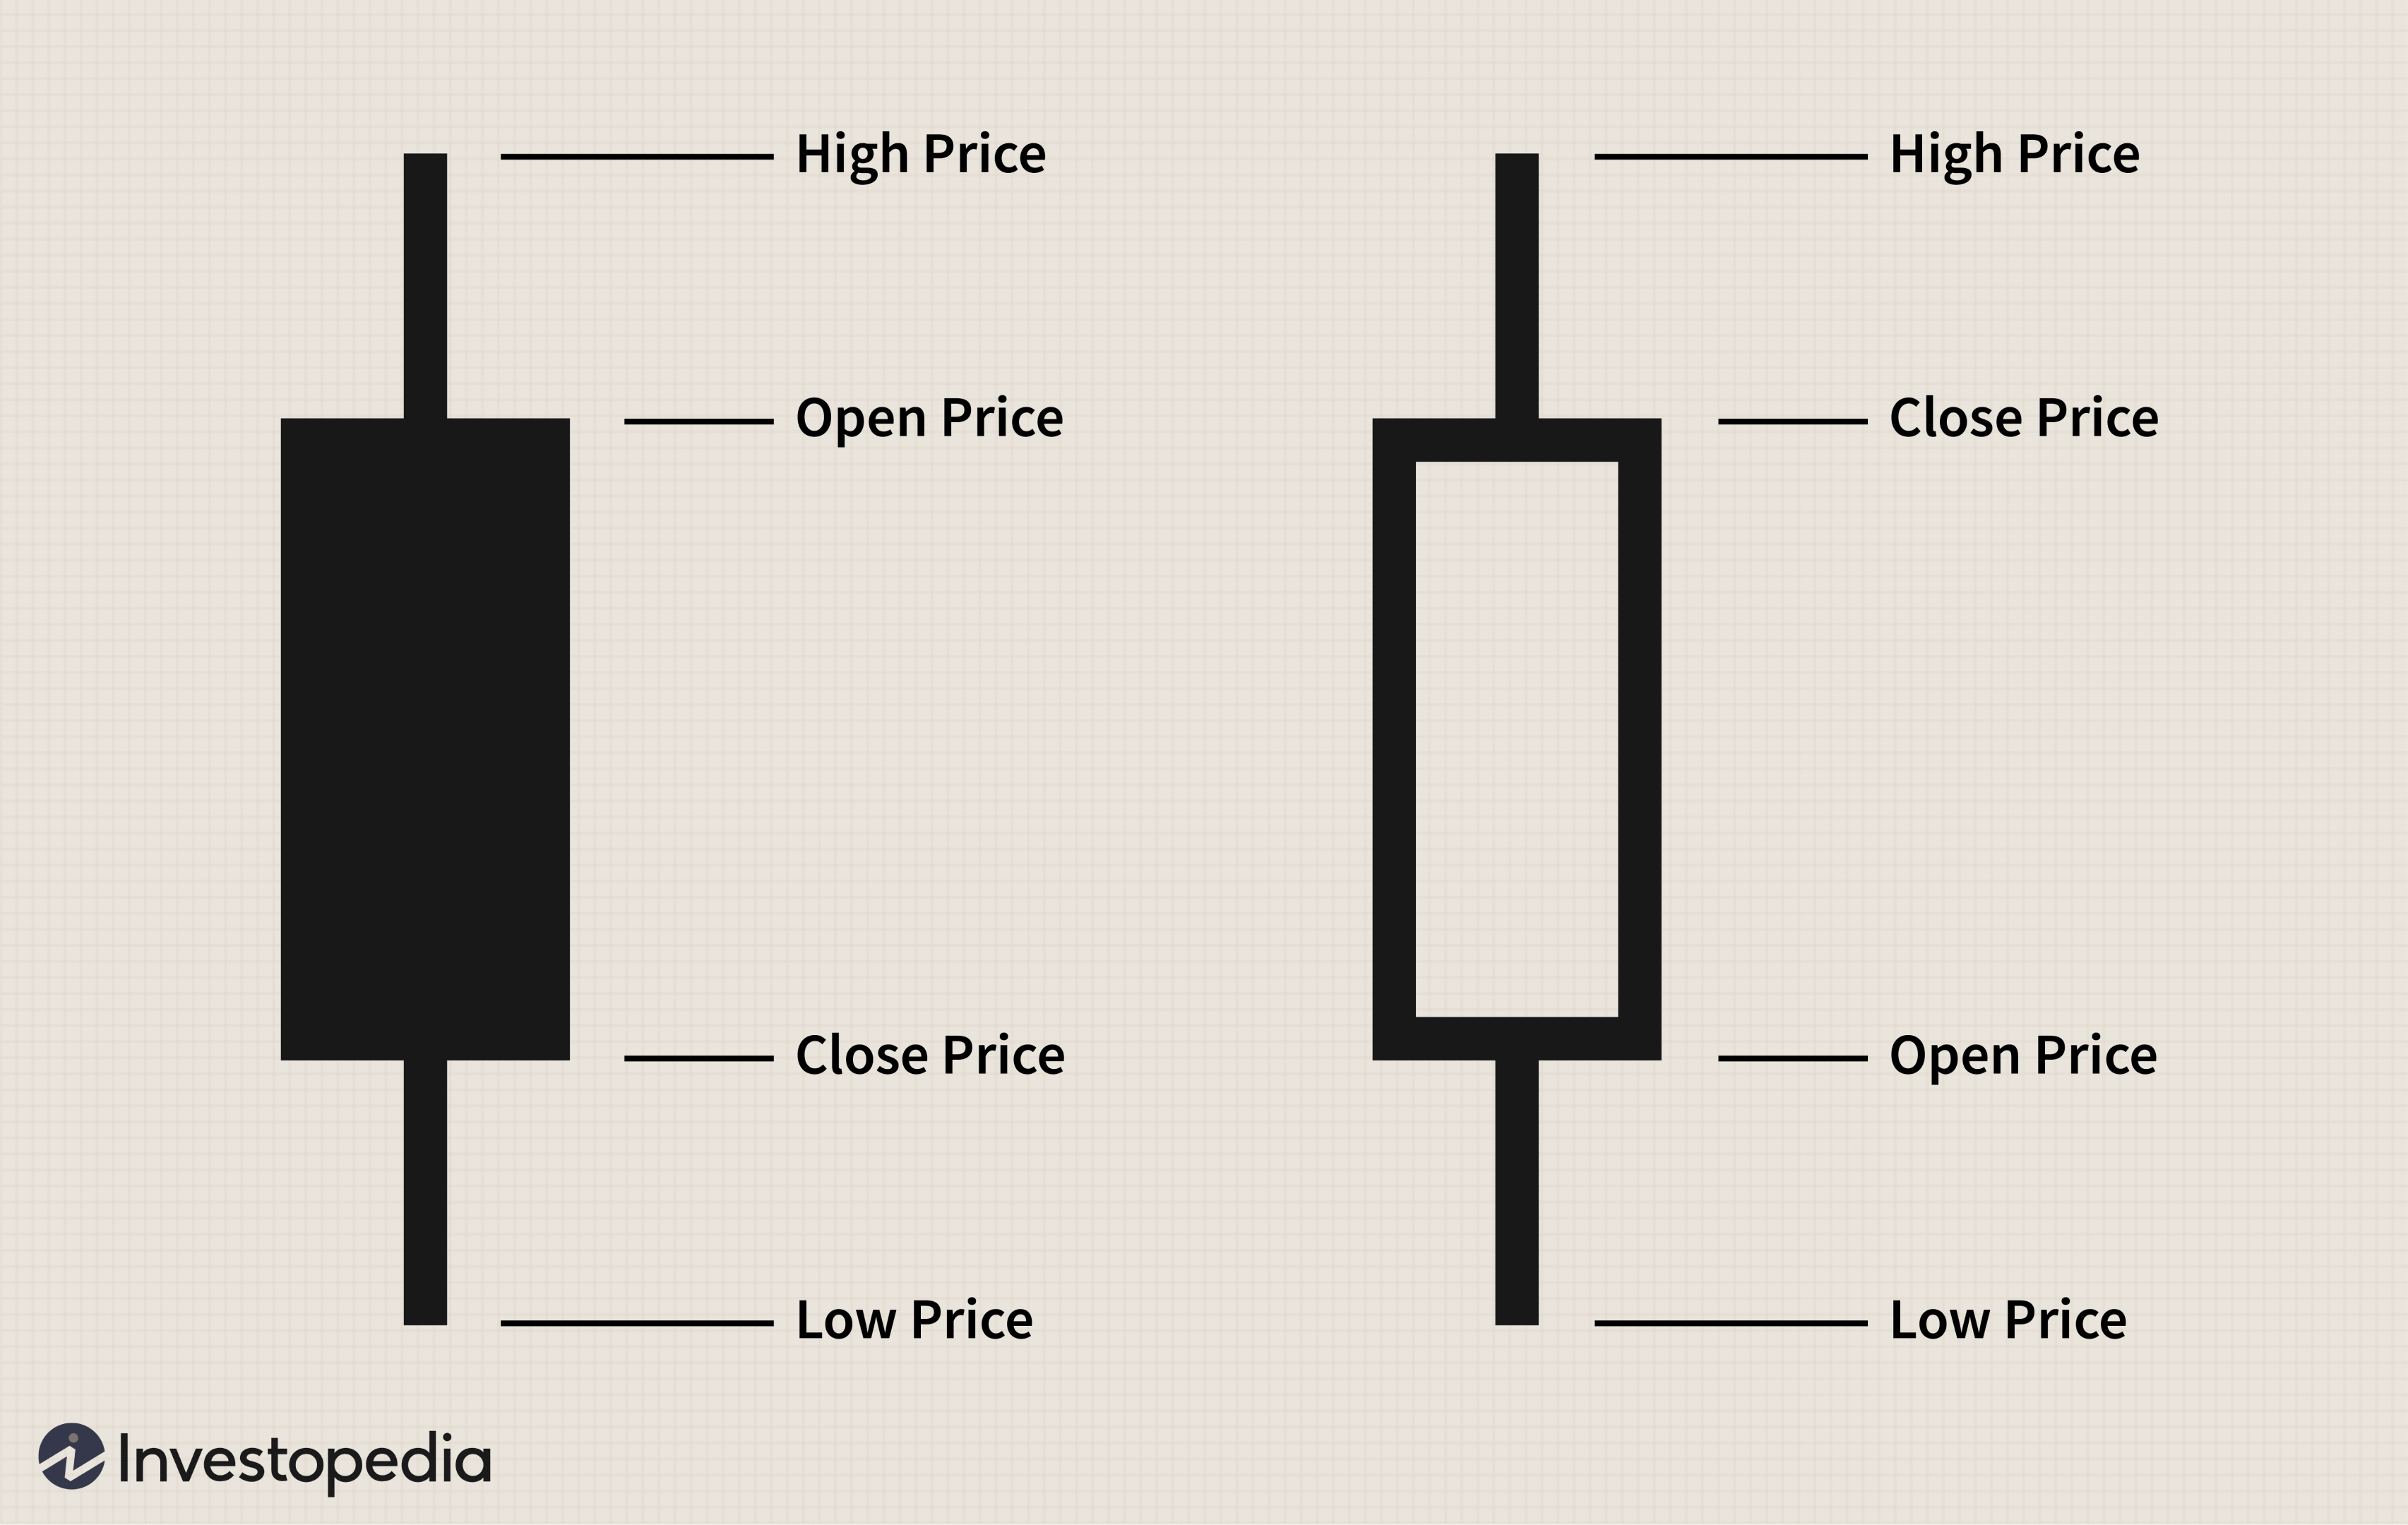
Like technical analysis? Patterns and stuff?Does anyone have a 5 minute explanation or a good video that does so on how to read the candle graphs? It’s definitely one thing I have yet to do any sort of research on and the few videos I’ve watched have left me scratching my head lol
There's different kind of candles. If you're talking about standard candles people use for trading, then there's also different time frames. For example. For day trading, I primarily use the daily chart with the 3min candles. For every 3 minutes, it creates a single candle. If the candle is green, that means that particular candle is above the closing price of the previous candle. If it's red, it's under the closing price of the previous candle. The "wicks" that you see on a candle indicate how high or low the price range hit for that particular candle.Does anyone have a 5 minute explanation or a good video that does so on how to read the candle graphs? It’s definitely one thing I have yet to do any sort of research on and the few videos I’ve watched have left me scratching my head lol
In the picture I uploaded shows what I'm talking about. The black candle (usually red by default but you can change colors) is the price of that particular time frame closing under the previous candle. Meaning the price is now lower than what it was "X" minutes ago (depending on what you set the candle at). The white candle in the image (usually green is default) is the opposite. The closing price in that time frame is above the previous candle.
As for the charts overall, it depends on how you plan on using them. Longer time frame will show you a bigger picture or pattern for a longer duration or an indication of where the stock may go. Example: the weekly chart or monthly chart will give a better understanding of where the stock will go (possibly) long term as opposed to short term. Looking to scalp, use the 1min candle or 3 minute candle. Day trade, I use the 3min and 5 min. Looking for a swing trade, 5min, 15min, 1hr, or even 1 day candles can help determine how long of a swing.
Also, when reading the chart, you also need other indicators. Trend line (I use the 9ema), vwap (volume weighted average price), 50ma (or 50sma), & 200ma (or sma). Looking for support and resistance can be a bit more intracant. But I also use the Fib retracement tool on day trades for possible pullbacks of support and resistance. Occasionally, I will use a different set up using Bollinger bands with a center line but that's something else entirely. Lol

Made a quick buck on a call option this A.M. on it. Looking for a pullback and might get back in.AMC ??????
Also, for those of you who are in $MVIS, today is the ASM (Annual Shareholders Meeting). That can and probably will impact the price based off sentiment and/or potential fundamentals. The meeting is at 11 A.M. (cst). One thing I would like to hear them mention is what their plan is moving forward. Especially on how they plan on making revenue, any mention of possible customers, further details on their lidar and plans on testing it (dates, time frames, ect), and any mention on their other verticals, such as the AR/VR/MR.

Thread Info
-
 Created
 -
2KReplies
-
40KViews
-
Participants list